


Exploring SimplyMap Data - Median Rent
Posted on Jan 29, 2016 by Admin
In a previous blog entry, we highlighted the benefits of having multiple years of data available for the same variable. This allows users to identify trends over time. Keeping with the same theme, this week we’ll take a look at how the median rent has changed between 2000, 2010 and 2015.
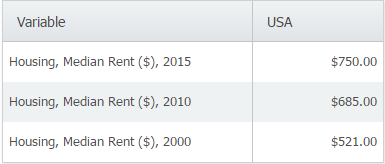
Let’s take a quick look at the US and move on to some cities we suspect may show a marked increase.
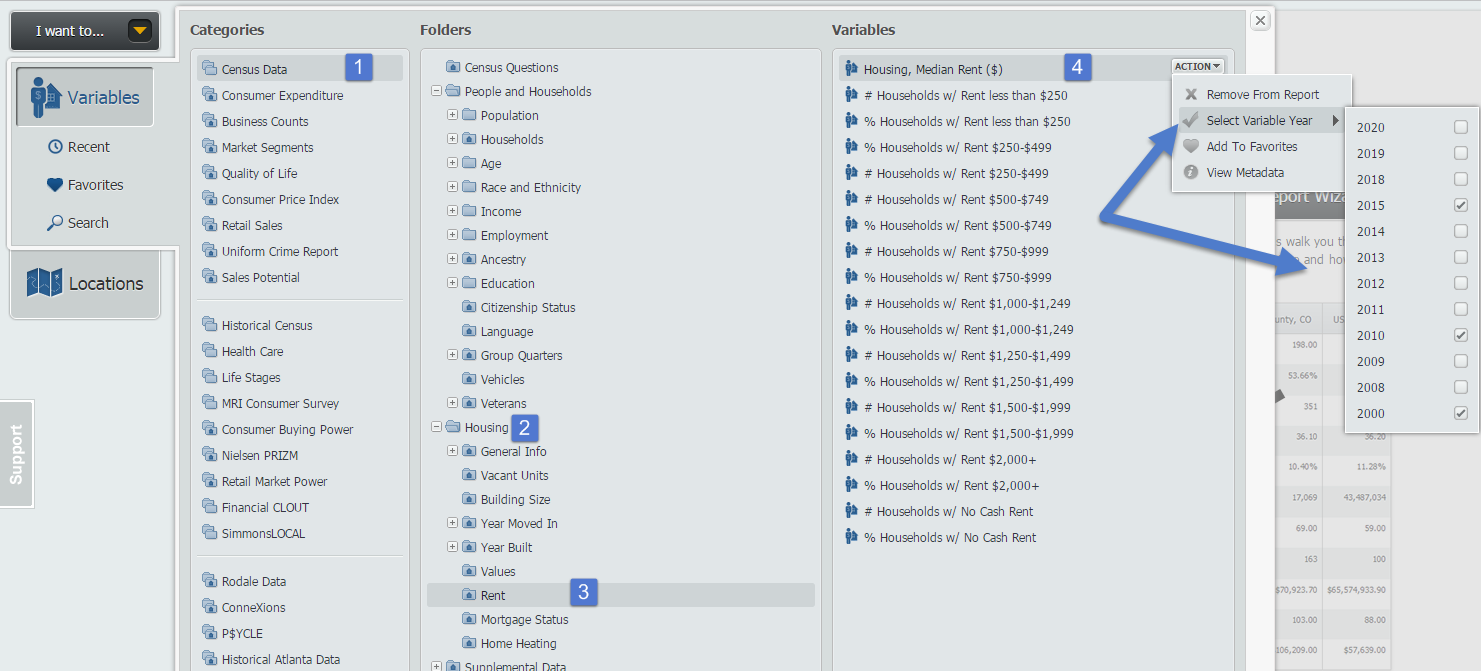
First, create a Standard Report and navigate through the median rent variable at this path: Census Data » Housing » Rent.
Next, hover over the variable and use the Select Variable Year option to select the years 2000, 2010 and 2015. Picture below for reference.
Close out the variables panel, and the report will generate:
To see how some other cities compare in their changes over time, return to the Locations menu to add your new locations. Here’s a report showing the median rents over time for: San Francisco, New York, Seattle, Chicago, Denver and San Antonio.
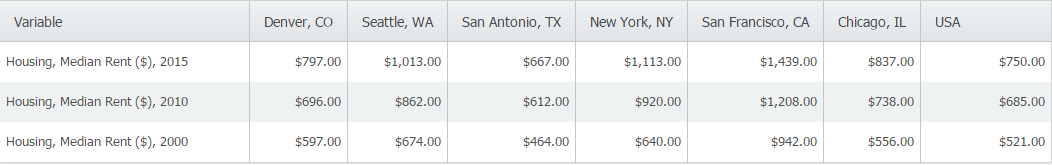
Key Takeaways from the Data:
- San Francisco’s median rent is almost double the median for the United States.
- San Antonio’s median rent is well below many other comparatively large markets.
We hope you enjoyed this week’s SimplyMap report. Stay tuned for more!
More from SimplyAnalytics
Posted on Jun 08, 2023 by Admin
We are excited to announce Mansi Nishit Trivedi as the winner of the 2023 BRASS Student Travel Award sponsored by SimplyAnalytics! Mansi, a Master of Information student at Dalhousie, has...
Posted on Nov 06, 2013 by Admin
SimplyMap includes a number of helpful support tools; guided wizards available when and where you need them, detailed help files, and an online support center with FAQs and searchable kno...
Posted on Dec 08, 2017 by Admin
Good afternoon, readers! This week we’re going to talk about project management in SimplyAnalytics and how to best take advantage of it. Why are projects needed? Many users have multiple...
Posted on Jul 19, 2016 by Admin
Are you a tech wizard? Maybe you’re an apprentice? Learn more about technology consumption behaviors using the Simmons MOSAIC Technology Adoption segments located within the SimmonsLOCAL ...
Posted on May 06, 2013 by Admin
The GRI team is looking forward to exhibiting at SLA 2013 at the San Diego Convention Center, June 9th through the 11th. The Special Libraries Association (SLA) is a nonprofit global orga...
Posted on Jun 16, 2016 by Admin
This week’s SimplyMap report is a quick tip that we hope you find useful and time saving. Did you know that SimplyMap will save all recently searched business queries for future usage? Le...
Posted on Jun 07, 2011 by Admin
We will be exhibiting at the Special Library Association Annual Conference in Philadelphia and the American Library Association conference in New Orleans later this month. Come and visit ...
Posted on May 17, 2012 by Admin
We will be exhibiting at the American Library Association (ALA) Conference in Anaheim Friday June 22nd - Monday June 25th. Visit us at Booth 421 to learn more about SimplyMap and enter ou...
Posted on Jun 09, 2016 by Admin
In this week’s blog, we’ll be featuring our newest data offering, PRIZM® Premier. If your institution currently subscribes to PRIZM data, this new module is available at no additional cos...
Posted on Feb 01, 2009 by Admin
Want to know the top 10 wealthiest ZIP codes in your state? How about the top 25 counties with the most elderly residents? Duke University students can now easily answer these questions a...