


Exploring SimplyMap Data: America’s Favorite Music
Posted on Sep 09, 2015 by Admin
This week’s SimplyMap report will set out to discover what America’s favorite type of music is. We will use data within the premium data package, SimmonsLOCAL to answer the question. The process outlined below can be completed within a matter of minutes - let’s get started!
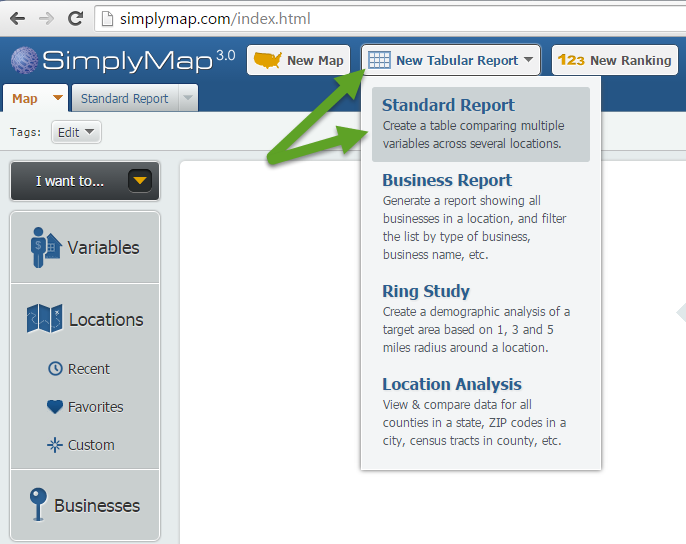
First, create a new Standard Report.
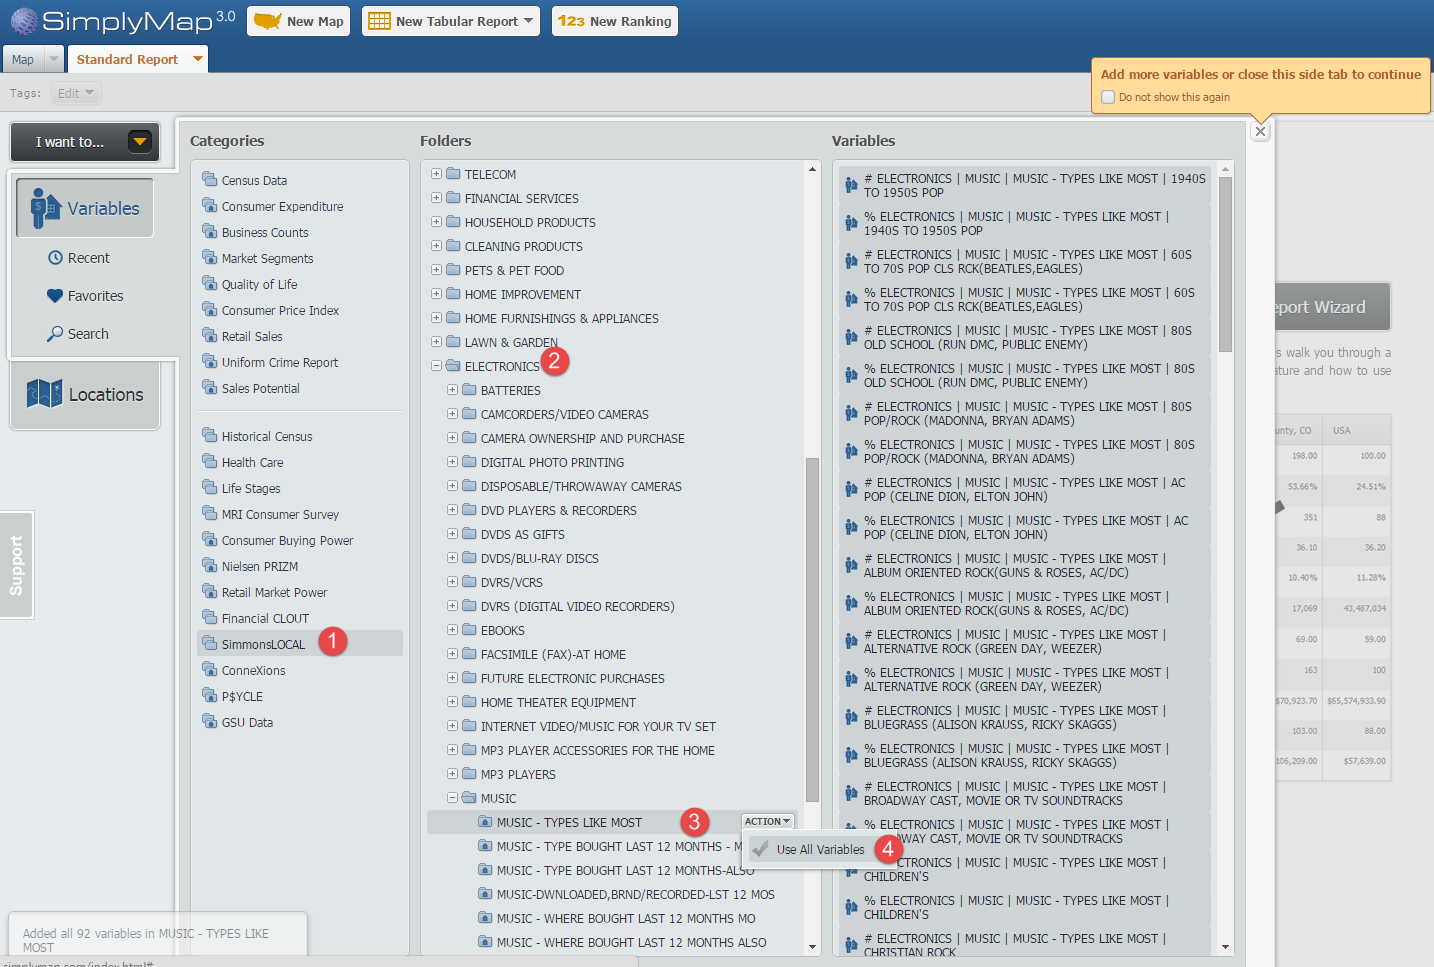
Next, locate the folder MUSIC - TYPES LIKE MOST. When you hover over this folder, use the option to Use All Variables from the action menu. Picture below for reference.
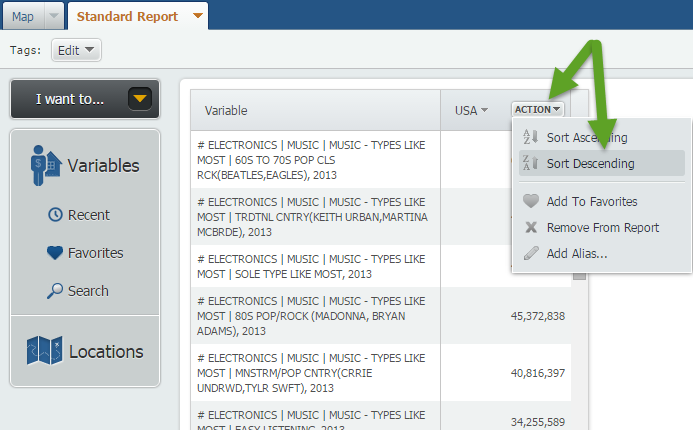
Close out the Variables panel to generate your report. Lastly, Sort Descending to see the highest totals represented up top. To do so, hover over the USA and select Sort Descending from the dropdown menu:
So what is America’s favorite type of music? According to our data, America’s favorite type of music is 60s and 70s Pop Classic Rock, featuring bands such as The Beatles and The Eagles! A distant second is Traditional Country featuring artists such as Keith Urban and Martina McBride.
For fun, let’s add a few other places and repeat the Sort Descending process.
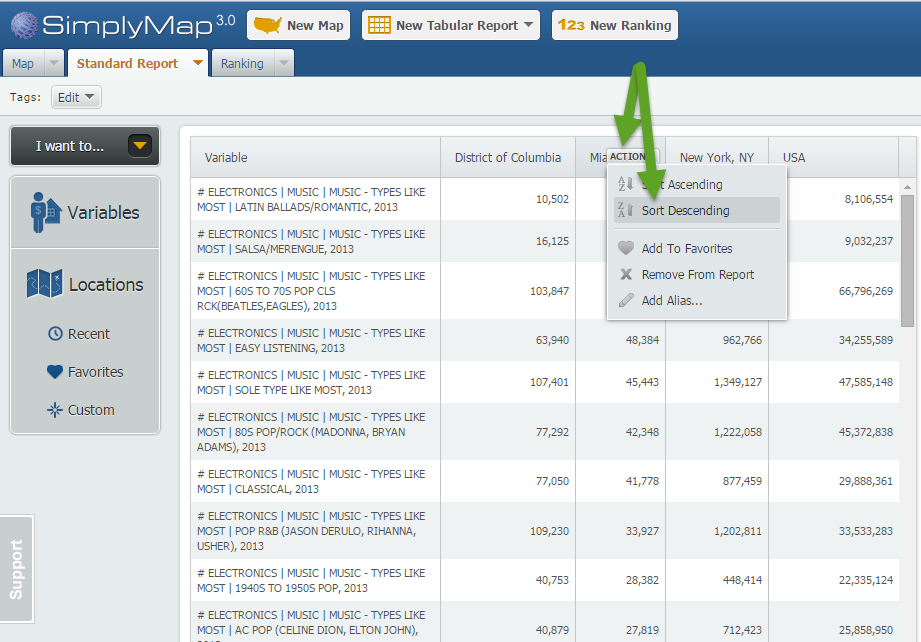
Washington D.C’s favorite music: Pop R&B (Jasun Derulo, Rhianna)
Miami’s favorite music: Latin Ballads followed closely by Salsa/Merengue
New York’s favorite music: 60s and 70s Pop Classic Rock
We hope you enjoyed exploring SimplyMap data with us this week. Stay tuned for more reports and tips!
More from SimplyAnalytics
Posted on Apr 17, 2009 by Admin
The Special Libraries Association will hold its Annual Conference in Washington, DC at the Washington Walter E. Washington Convention Center from June 14-17 2009. The conference will crea...
Posted on May 31, 2011 by Admin
Kenneth Johnson of the Science, Industry, and Business Library at the New York Public Library recently provided a "boot camp" on the library's market research resources to budding entrep...
Posted on Jul 28, 2013 by Admin
We recently discovered some interesting data on participation and attitudes towards recycling, and decided to dig a bit deeper into our Experian SimmonsLOCAL data. This data package inclu...
Posted on Jun 01, 2014 by Admin
Visit the SimplyMap team at the ALA Annual Conference and Exposition in Las Vegas later this month. We will be at booth 1271, offering product demonstrations, tips & tricks, and of co...
Posted on Mar 09, 2010 by Admin
The GRI team will be exhibiting at the 2010 Public Library Association conference later this month at the Oregon Convention Center in Portland, OR. The PLA National Conference is the prem...
Posted on Jan 10, 2024 by Admin
We are delighted to announce our sponsorship of the Midwest Entrepreneurship Case Competition! At SimplyAnalytics, we understand the power of data-driven decision-making in entrepreneursh...
Posted on May 15, 2015 by Admin
In this week’s SimplyMap report, we want to share with you the many options available when exporting maps in SimplyMap. In SimplyMap, when a user selects Export Map Image from the Actions...
Posted on Sep 10, 2010 by Admin
SimplyMap Canada is now available at several Canadian institutions, including York University and Ryerson University, in Toronto. SimplyMap Canada has all of the great features included i...
Posted on Feb 17, 2015 by Admin
Our recent trip to Chicago exhibiting at the ALA Midwinter Meeting inspired this week’s SimplyMap blog post. Today, we’re going to demonstrate how to use business points in SimplyMap to a...
Posted on Apr 27, 2015 by Admin
In this week’s write up we want to share some quick tips and tricks that you might not yet know about in SimplyMap. TIP #1 Did you know that you can share your work? SimplyMap allows you ...