 Go up


Exploring SimplyMap Data - Organic Food Use
Posted on Mar 03, 2016 by Admin
In this week’s SimplyMap report we take a look into the SimmonsLOCAL dataset to determine which cities in America have the highest percentage of residents who consume organic food products. Let’s jump right in.
Before we rank the variable, % FOOD - GENERAL | ORGANIC FOODS | ORGANIC FOODS - HH USES? | YES, 2014 let’s do a quick search for “organic” to see how many related variables are in SimplyMap. Open the Variables tab, click on Search, and type in “organic”.
You will then get a list of all variables in SimplyMap that contain the keyword organic.
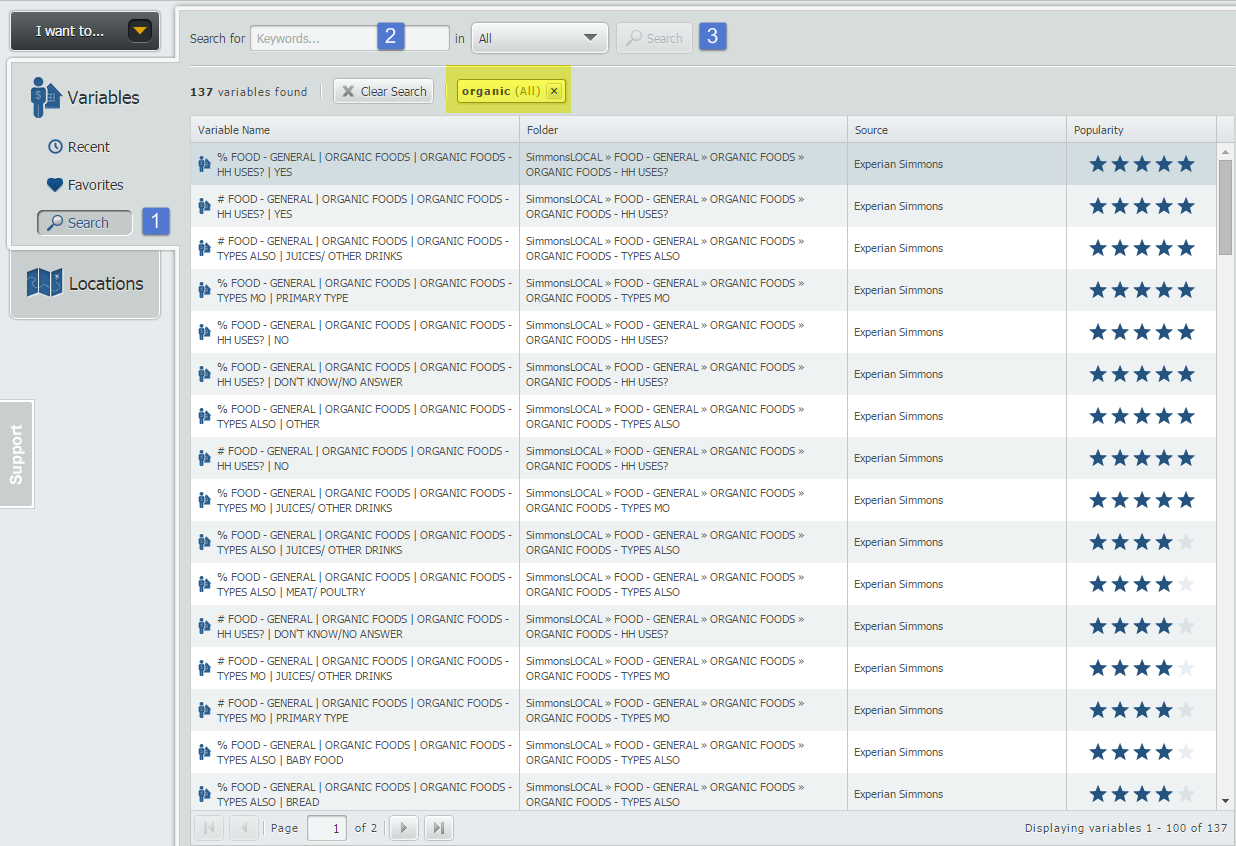
SimplyMap has a grand total of 137 “organic” associated variables across all datasets (the majority being within the SimmonsLOCAL package) with variables such as organic bread, and organic baby food use. Interesting!
It’s helpful to see what the US percentage is for our organic usage variable. This will help get a sense of the cities compare to the national total. Create a Standard Report with the US as your location, and the variable % FOOD - GENERAL | ORGANIC FOODS | ORGANIC FOODS - HH USES? | YES, 2014.
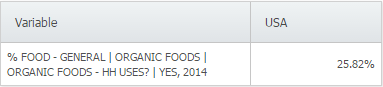
It looks like roughly one-quarter of the US claim to consume organic foods. On to the ranking.
Click on New Ranking at the top of SimplyMap. Next, select Recent from the Variables panel to quickly find and rank the variable used above. Lastly, set the Analyze Data By dropdown to Cities. Results below!
Note: We applied a population filter of > 200,000 residents to remove any percentages that might be unusually high due to a small population total.
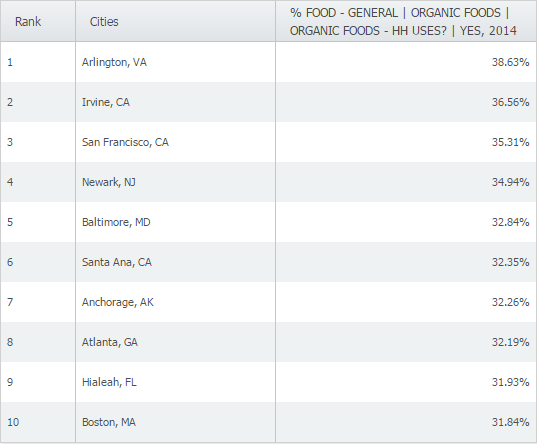
Any surprises in the results above?
We hope you enjoyed this week’s SimplyMap report. Stay tuned for more!
More from SimplyAnalytics


Posted on Feb 24, 2019 by Admin
We will be exhibiting at SCELC* Vendor Day on March 14th. Visit us at table 510 and attend one of our two sessions demonstrating SimplyAnalytics. The presentations will highlight newly av...
Posted on Feb 05, 2015 by Admin
In this week’s edition of exploring SimplyMap data, we take a look at America’s coffee drinkers. SimplyMap contains more than 100 coffee related variables, including consumer spending on ...
Posted on Apr 27, 2015 by Admin
In this week’s write up we want to share some quick tips and tricks that you might not yet know about in SimplyMap. TIP #1 Did you know that you can share your work? SimplyMap allows you ...
Posted on May 26, 2020 by Admin
Hello readers! We hope you are doing well, and thank you for your continued support of SimplyAnalytics. We are excited to announce that scatterplots are officially live! Scatter plots ar...
Posted on Nov 19, 2019 by Admin
Hello readers! Today we are bringing you a new blog entry inspired by a recent Help Desk question. If you ever have any questions about SimplyAnalytics, please do not hesitate to reach ou...
Posted on Jun 05, 2025 by Admin
We’re excited to announce that SimplyAnalytics will be exhibiting at the American Library Association (ALA) Annual Conference in Philadelphia! We’re thrilled to showcase how SimplyAnalyti...
Posted on Apr 18, 2017 by Admin
We look forward to attending the Texas Library Association Conference this week in San Antonio and visiting with the library community. Stop by our new SimplyAnalytics booth (2029) and ta...
Posted on Mar 13, 2023 by Admin
Hello readers! Today, we’re excited to officially introduce the Location Query Report in SimplyAnalytics. The Location Query Report is a powerful feature in SimplyAnalytics that allows us...
Posted on Dec 02, 2014 by Admin
Today we take a look at one of the more advanced features in SimplyMap - editing the map legend. Editing the map legend is a great way to not only customize how the data is distributed on...
Posted on Nov 04, 2013 by Admin
SimplyMap 3.0 is here, and uses the latest technology to provide better performance, improved reliability, and powerful new features. There are many improvements designed to make it easie...