 Go up
Go up


Rise of the Tablet
Posted on Nov 20, 2015 by Admin
In a previous blog we demonstrated the power of utilizing multiple years for the same variable. We found that the usage of Amazon.com had grown substationally from 2008-2014. In this week’s blog, we’ll take a look at the growth of tablet ownership in the US. It seems iPads, Surface Pros and other tablets are everywhere these days. Let’s take a look at the data to see how much tablet ownership has grown in the last 3 years.
To find this information, we’ll look into the SimmonsLOCAL data set. For those unfamiliar with this data, SimmonsLOCAL is a powerful targeting and profiling system that provides insights into consumer behavior for all of America's 210 media markets on a local level with 60,000+ data variables, including over 450 categories and 8,000 specific brands.
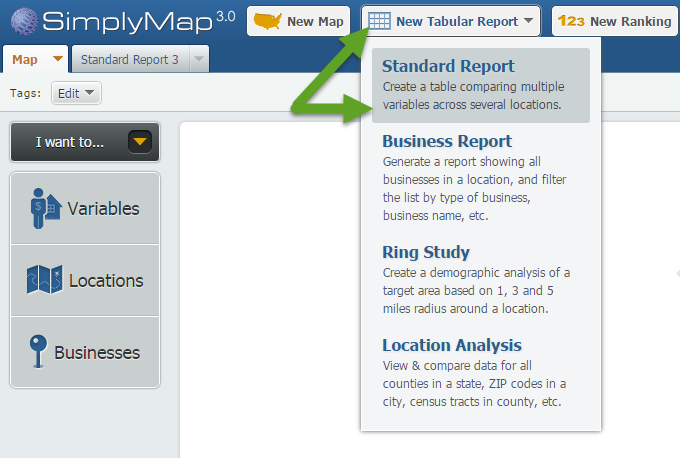
The quickest means of pulling the data here would be to create a Standard Report. First, click on New Tabular Report > Standard Report.
Next, navigate through this path: SimmonsLOCAL » CELL/SMARTPHONES/TABLETS » TABLET (NOT PC/LAPTOP) » TABLET (NOT PC/LAPTOP)-DO YOU OWN?
Hover over the variable with the response YES, shown below:
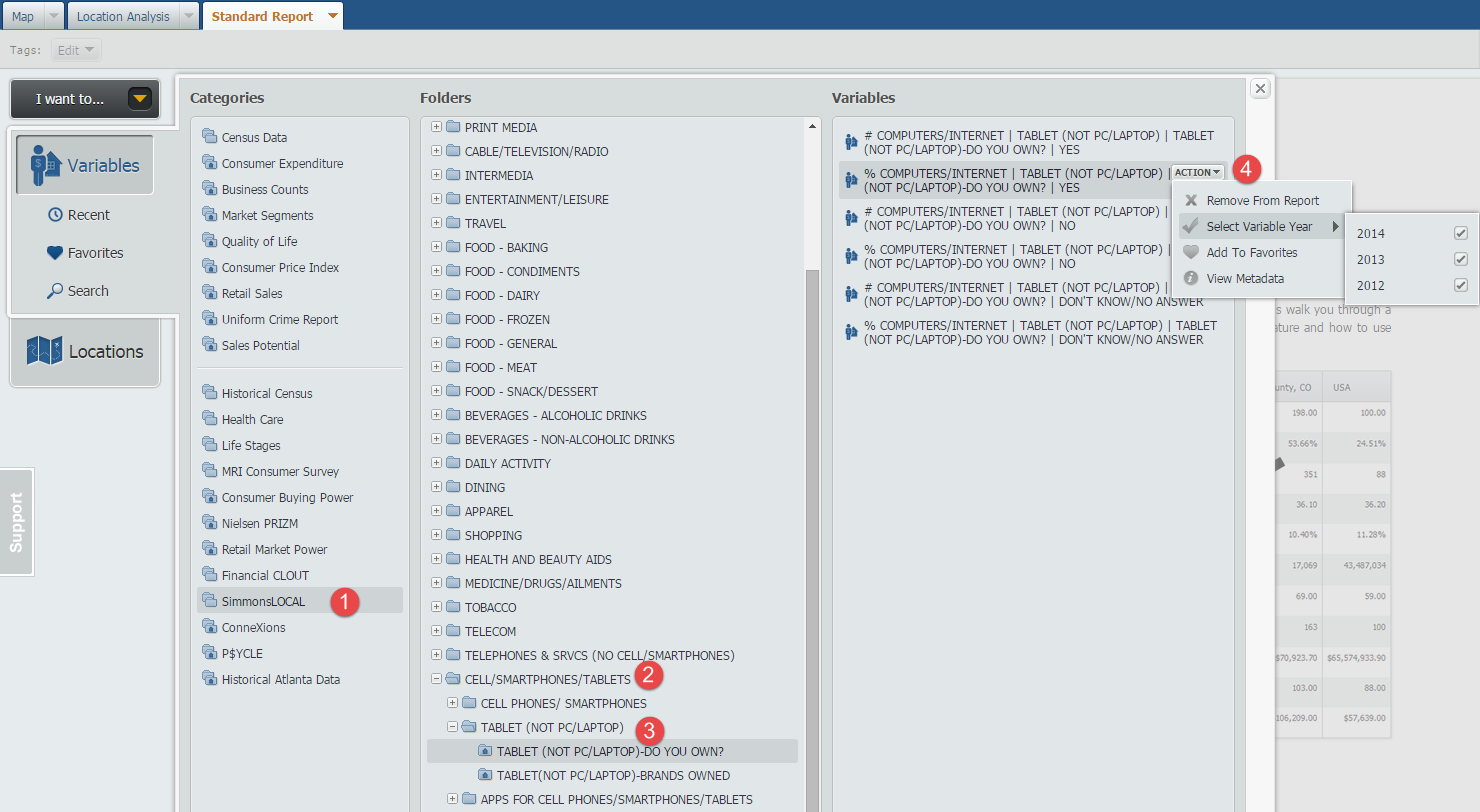
At the action drop down, hover over Select Variable Year and select the 3 year options available within the SimmonsLOCAL data set: 2012, 2013 and 2014.
Close out the Variables panel to generate your report for the US.
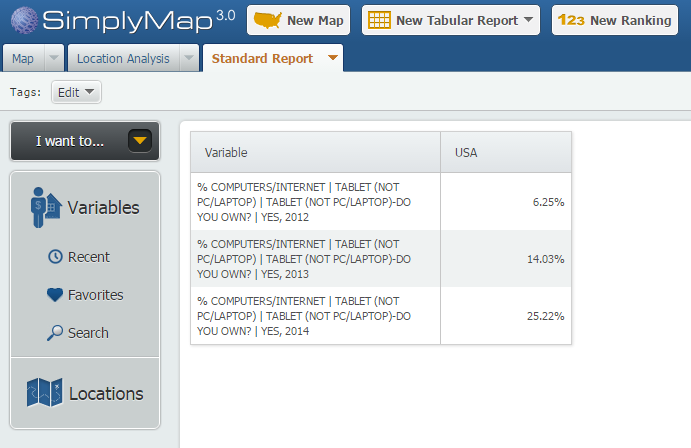
The data reveals that tablet ownership in the US has quadrupled in only a few years (2012-2014)! We assumed there would be a growth in ownership, but it is still surprising to see the estimates at a 4x growth within three years.
For fun, let’s take a look at some brand name tablet ownership numbers.
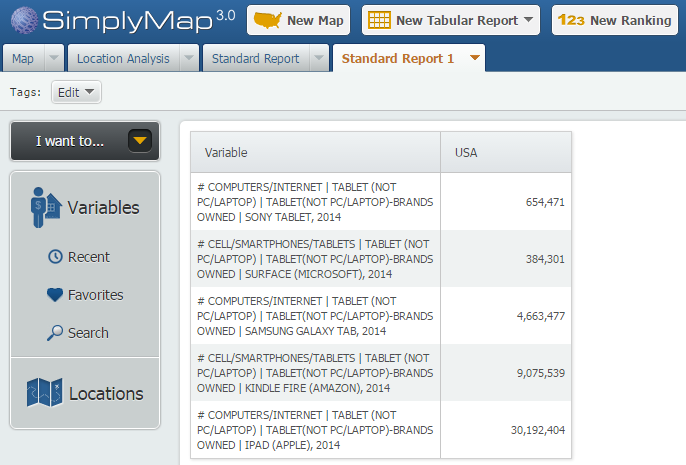
Not surprising, the iPad holds a significant advantage in the tablet ownership numbers with the Kindle Fire coming in at a distant second.
We hope you enjoyed this week’s SimplyMap report. Stay tuned for more tips and reports!
More from SimplyAnalytics


Posted on Nov 04, 2013 by Admin
SimplyMap 3.0 is here, and uses the latest technology to provide better performance, improved reliability, and powerful new features. There are many improvements designed to make it easie...
Posted on Jan 17, 2011 by Admin
Come visit the Geographic Research booth at the Ontario Library Association Super Conference this season. The conference will take place on February 2-5, 2011 at the Metro Toronto Convent...
Posted on Sep 28, 2018 by Admin
Welcome readers! Today we have a quick feature highlight that will assist you in browsing and searching for data variables. All data variables have a path where they reside within their d...
Posted on Sep 10, 2019 by Admin
Hello readers! It’s been a minute since our last tutorial post, but you can expect to see more content on a weekly basis moving forward. “From the Help Desk” is a new feature on the blog ...
Posted on Nov 24, 2014 by Admin
In this week’s report, we research America’s most educated cities. SimplyMap contains a total of 111 educational attainment variables, including general population and by race. We used th...
Posted on Oct 16, 2015 by Admin
Did you know that SimplyMap includes the ability to export Shapefile data for use in desktop mapping software (such as MapInfo or ArcGIS)? This advanced feature extends the power of Simpl...
Posted on Mar 02, 2018 by Admin
In this week’s blog we’ll take a look at how to enter an address in SimplyAnalytics to find the Census Block Group or Census Tract. Let’s get started! Use Case: You want to analyze the ar...
Posted on Oct 12, 2010 by Admin
NC LIVE, a member-driven library service organization dedicated to providing online information services that support education, enhance statewide economic development, and increase qu...
Posted on Feb 05, 2015 by Admin
Our Winter Sweepstakes has begun! Enter to win an iPad Mini 3 or Kindle Fire. How to Enter: Follow @SimplyMap on Twitter Like our SimplyMap Facebook Page for a 2nd Chance to Win If you ...
Posted on Jan 23, 2024 by Admin
We are excited to again make the trip to Los Angeles for SCELCapalooza 2024 hosted at Loyola Marymount University! Please drop by our table on Wednesday, Feb. 28th to learn more about Sim...