


Exploring SimplyMap Data: P$YCLE
Posted on Apr 28, 2016 by Admin
In this week’s SimplyMap report we’ll take a look at one of our newer data packages offered, P$YCLE® by Nielsen.
P$YCLE® is a segmentation system that evaluates consumers using key demographic factors that have the greatest effect on their financial behaviors, such as income, age, presence of children, home ownership and Nielsen' proprietary measure of Income Producing Assets (IPA). The result is a total of 58 P$YCLE® segments, within 12 P$YCLE Lifestage Groups, each with distinct usage patterns for financial and investment products and services.
Let’s take a look at the top segments from a few cities around the US. First, create a new Standard Report (under New Tabular Report > Standard Report). Next, open the variables panel and navigate to the P$YCLE® segments folder - from there, select Add All Variables from the action dropdown that appears. Close out the panel to generate your report for the US.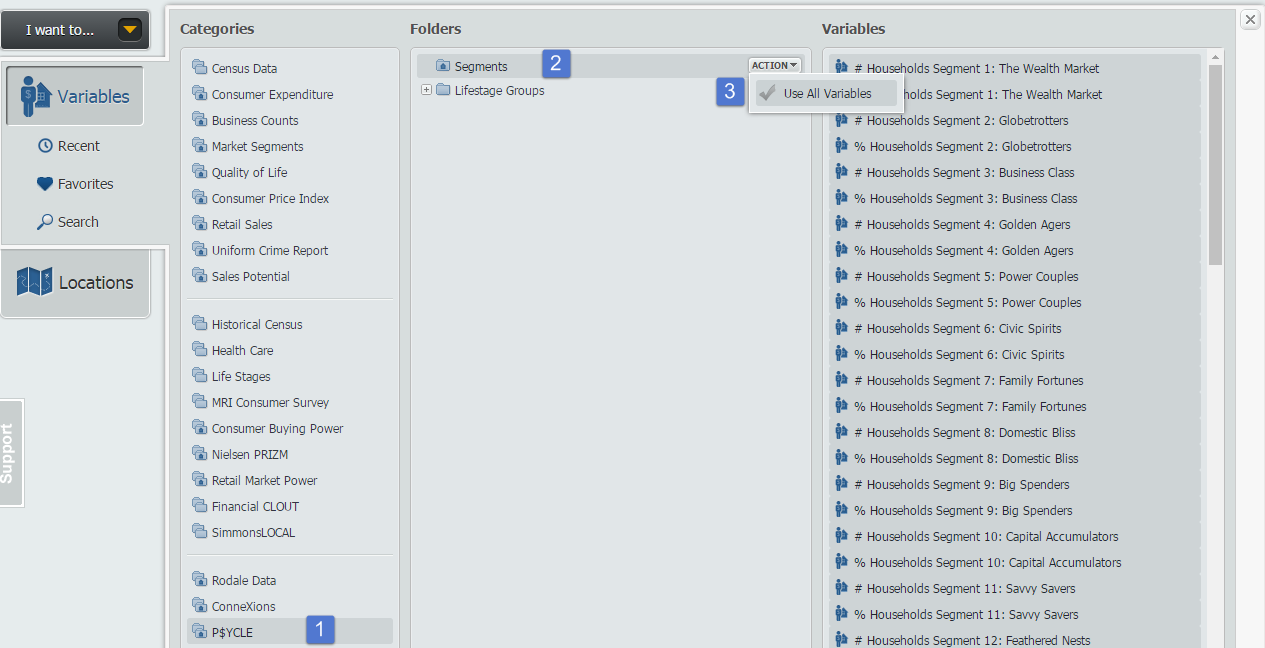
Hover over the Location header in your report and select Sort Descending to view the top segment for the United States:
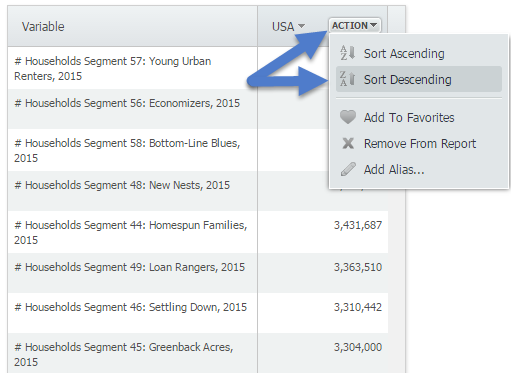
The top segment for the United States is Segment 57: Young Urban Renters. To read more about this segment, hover over the variable and select View Metadata.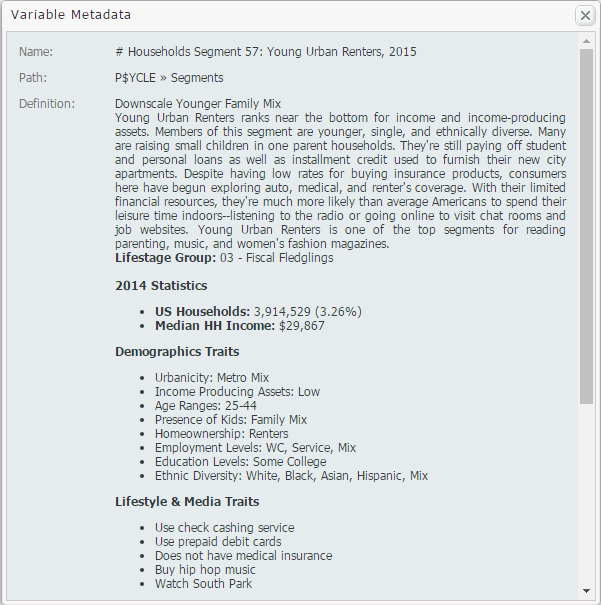
Lastly, add some locations of interest to your report and repeat the process above for each heading to view its highest segment. Results below!
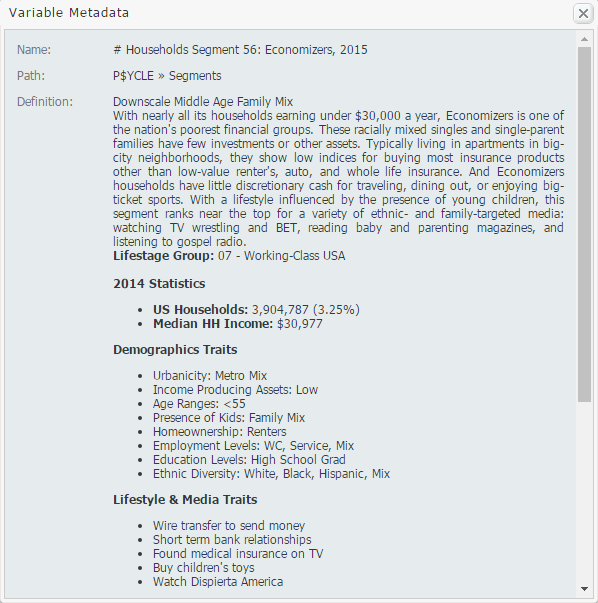
Houston, TX - Segment 56: Economizers
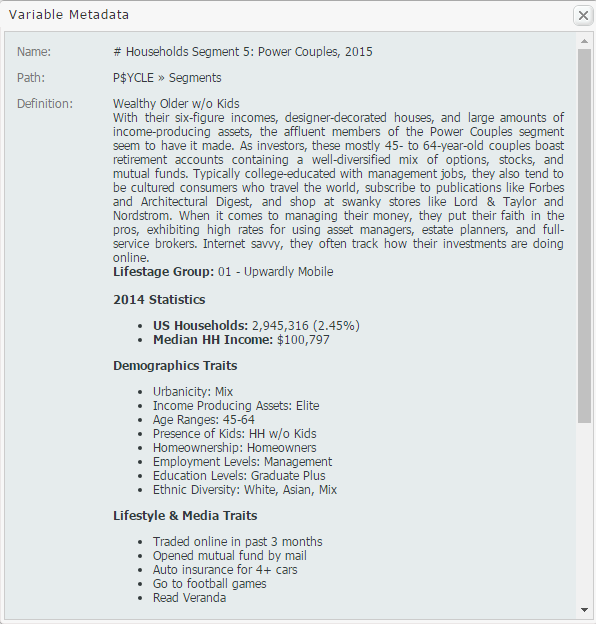
San Francisco, CA - Segment 5: Power Couples
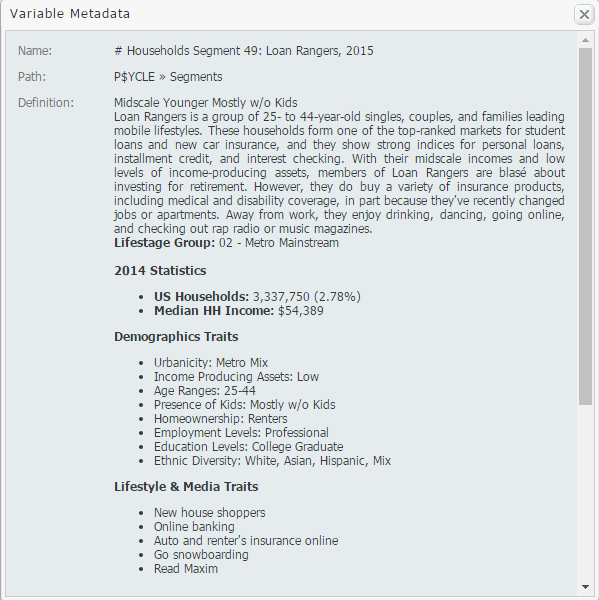
Pittsburgh, PA - Segment 49: Loan Rangers
We hope you enjoyed this week’s SimplyMap report reviewing the P$YCLE® data set - if your institution is interested in a trial of this package, please email support@geographicresearch.com
More from SimplyAnalytics
Posted on Sep 18, 2015 by Admin
With tens of thousands of variables available in SimplyMap, it’s common for users to wonder whether or not a particular variable they have in mind is available in SimplyMap. This is where...
Posted on Oct 30, 2018 by Admin
We are pleased to be exhibiting at this year's 30th Annual Charleston Library Conference! The Charleston Vendor Showcase will be held Tuesday, November 6, 2018, from 10:30 a.m. to 6:00 p....
Posted on Jun 02, 2017 by Admin
We can't wait for ALA Annual this Summer, and the opportunity to share SimplyAnalytics with the ALA community. Stop by the SimplyAnalytics booth (1339) and take a peak at what we've been ...
Posted on Apr 18, 2008 by Admin
A team of librarians at Drexel University has developed a detailed poster to introduce SimplyMap as a new research tool for the student body. The poster was launched on Drexel Research Da...
Posted on Jun 09, 2016 by Admin
In this week’s blog, we’ll be featuring our newest data offering, PRIZM® Premier. If your institution currently subscribes to PRIZM data, this new module is available at no additional cos...
Posted on Jun 09, 2021 by Admin
Hello (virtual) ALA attendees! Thank you for dropping by our booth to learn more about SimplyAnalytics. Please email us if you have any questions or would like a live demo or free 30 day ...
Posted on May 23, 2012 by Admin
We will be exhibiting at the Special Libraries Association (SLA) annual conference and Info-Expo at McCormick Place in Chicago Sunday June 15th - Tuesday July 17th. Visit us at Booth 124 ...
Posted on Mar 13, 2023 by Admin
Hello readers! Today, we’re excited to officially introduce the Location Query Report in SimplyAnalytics. The Location Query Report is a powerful feature in SimplyAnalytics that allows us...
Posted on Jun 01, 2014 by Admin
Visit the SimplyMap team at the ALA Annual Conference and Exposition in Las Vegas later this month. We will be at booth 1271, offering product demonstrations, tips & tricks, and of co...
Posted on Nov 23, 2012 by Admin
Men's Health magazine is charting vanity in US cities, with help from SimplyMap. What did they find? The Sunshine State, with a long history of going to great lengths to look good, tops t...