 Go up


Exploring SimplyMap Data - Median Rent
Posted on Jan 29, 2016 by Admin
In a previous blog entry, we highlighted the benefits of having multiple years of data available for the same variable. This allows users to identify trends over time. Keeping with the same theme, this week we’ll take a look at how the median rent has changed between 2000, 2010 and 2015.
Let’s take a quick look at the US and move on to some cities we suspect may show a marked increase.
First, create a Standard Report and navigate through the median rent variable at this path: Census Data » Housing » Rent.
Next, hover over the variable and use the Select Variable Year option to select the years 2000, 2010 and 2015. Picture below for reference.
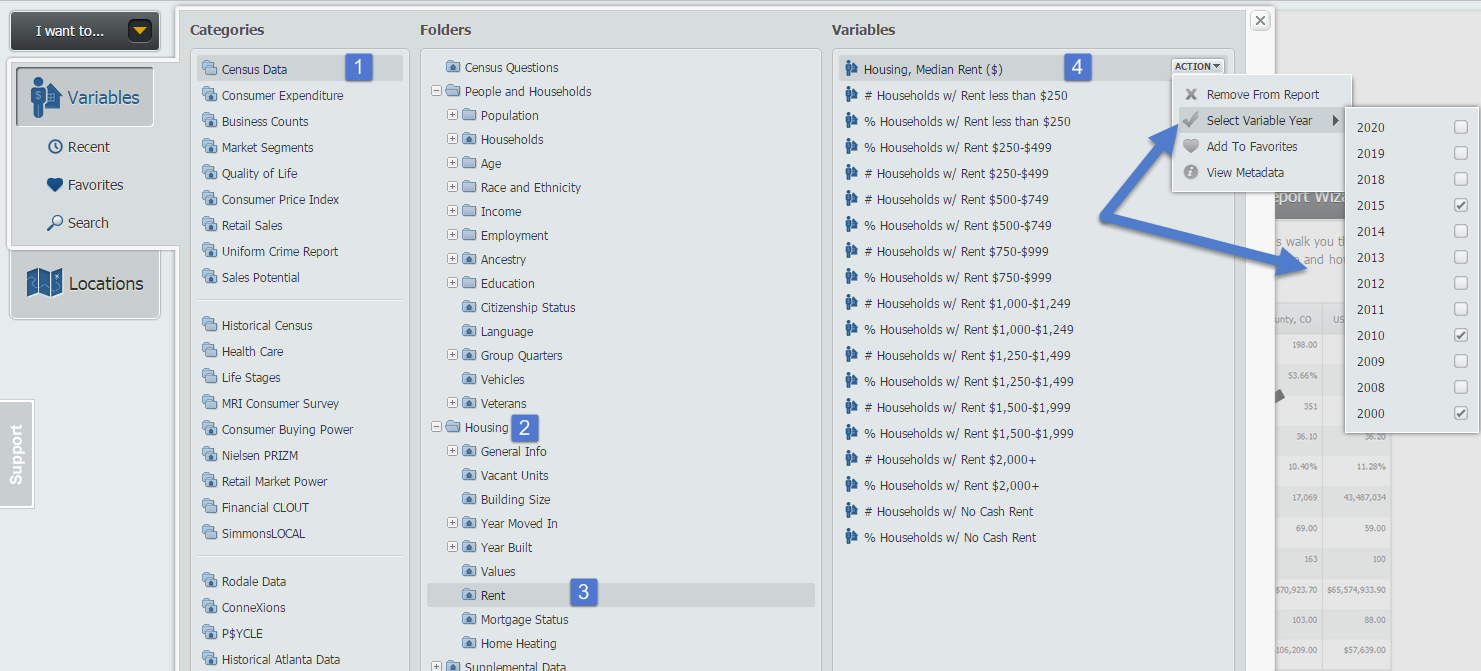
Close out the variables panel, and the report will generate:
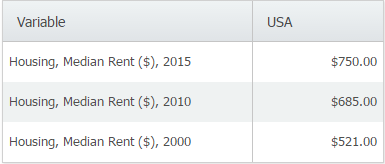
To see how some other cities compare in their changes over time, return to the Locations menu to add your new locations. Here’s a report showing the median rents over time for: San Francisco, New York, Seattle, Chicago, Denver and San Antonio.

Key Takeaways from the Data:
- San Francisco’s median rent is almost double the median for the United States.
- San Antonio’s median rent is well below many other comparatively large markets.
We hope you enjoyed this week’s SimplyMap report. Stay tuned for more!
More from SimplyAnalytics


Posted on Feb 02, 2024 by Admin
We are excited to be back exhibiting at PLA this April in Columbus, OH. Join us at Booth #2631 to discover how SimplyAnalytics can help libraries understand their service area, assist sma...
Posted on Nov 17, 2014 by Admin
Our recent series Exploring SimplyMap Data Reports has focused on creating ranking reports for unique variables. Accordingly, we thought it would be helpful to write a quick tip on how to...
Posted on Apr 30, 2008 by Admin
Doreen Harwood, Business Librarian from the University of Washington has developed a series of detailed tutorials on using SimplyMap. The tutorials, which are Flash-based and interactive,...
Posted on Jun 21, 2019 by Admin
Come visit the SimplyAnalytics booth (#3010) at the upcoming ALA 2019 show in Washington, D.C.! Our team will be on hand offering quick demos of SimplyAnalytics, answering questions and s...
Posted on Dec 15, 2014 by Admin
Visit the SimplyMap team at the ALA Midwinter Meeting in Chicago late January. We will be at booth #2824 offering product demonstrations, tips & tricks, and of course Ghirardelli Choc...
Posted on Oct 24, 2019 by Admin
Hi everybody! This week we wanted to bring you something unique, so we’re taking you behind the scenes to show you what goes in to setting up the SimplyAnalytics conference booth you’ve c...
Posted on Jun 16, 2016 by Admin
This week’s SimplyMap report is a quick tip that we hope you find useful and time saving. Did you know that SimplyMap will save all recently searched business queries for future usage? Le...
Posted on Aug 13, 2015 by Admin
In this quick SimplyMap report, we use Census data to help us identify which city in the United States has the highest percentage of residents who reported walking to work as their mode o...
Posted on Dec 03, 2012 by Admin
Come visit the Geographic Research booth at the Ontario Library Association Super Conference this season. The conference will take place on January 30 - February 2, 2013 at the Metro Toro...
Posted on May 10, 2016 by Admin
One benefit of data and applications like SimplyMap is the ability to visualize information. In this week’s report, we’ll take a quick look at some branding preferences in contiguous Amer...