 Go up


View Spotlight: Related Data Table
Posted on Jul 30, 2018 by Admin
Hello readers! Welcome to this week’s blog. This week we will feature the Related Data Table view and how you can use it to maximize your productivity in SimplyAnalytics.
What is it?
The Related Data Table View is designed to allow you to quickly add in many similar data variables at once. For example, if you add "% Households w/ Income $50,000 to $74,999" the report will also show all of the other income ranges as well.
Some other use cases: you want to quickly add in all life-stage data variables, or PRIZM psychographic segments, or all Language variables.
Example
Identify what the top PRIZM household segment is for a ZIP Code. The PRIZM Dataset is a marketing segmentation system that allows you to understand the demographic and lifestyle/consumer traits of any location in the United States. This data is very popular within marketing departments across many large companies, and we are happy to offer it as an add on module to your subscription.
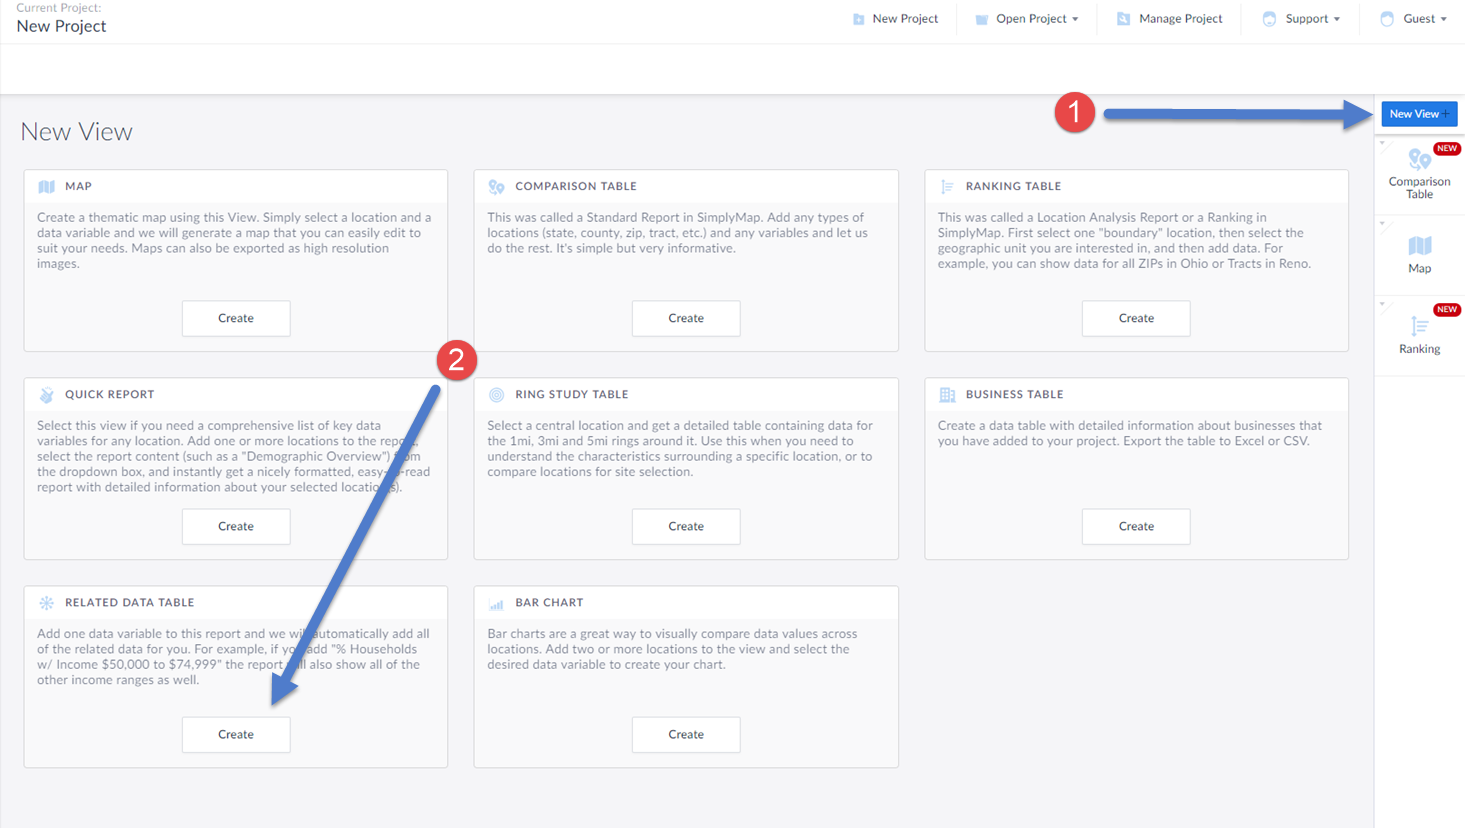
(1) Select New View from the top-right of the interface
(2) Click on the Create button under the Related Data Table section
This will open up the Edit Related Data Table screen. This is where you add in your location, and data variable. In this example, we will select a random PRIZM Premier segment. Keep in mind, this report will add in all of the segments for you.
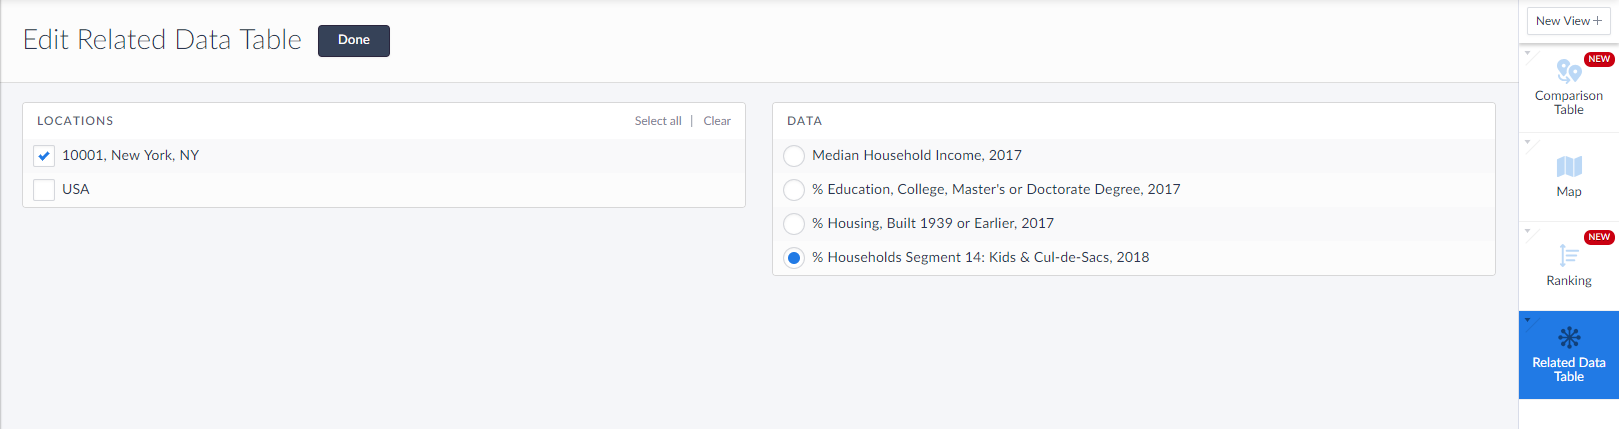
Select Done once the location and data variable have been added, and the report will generate.
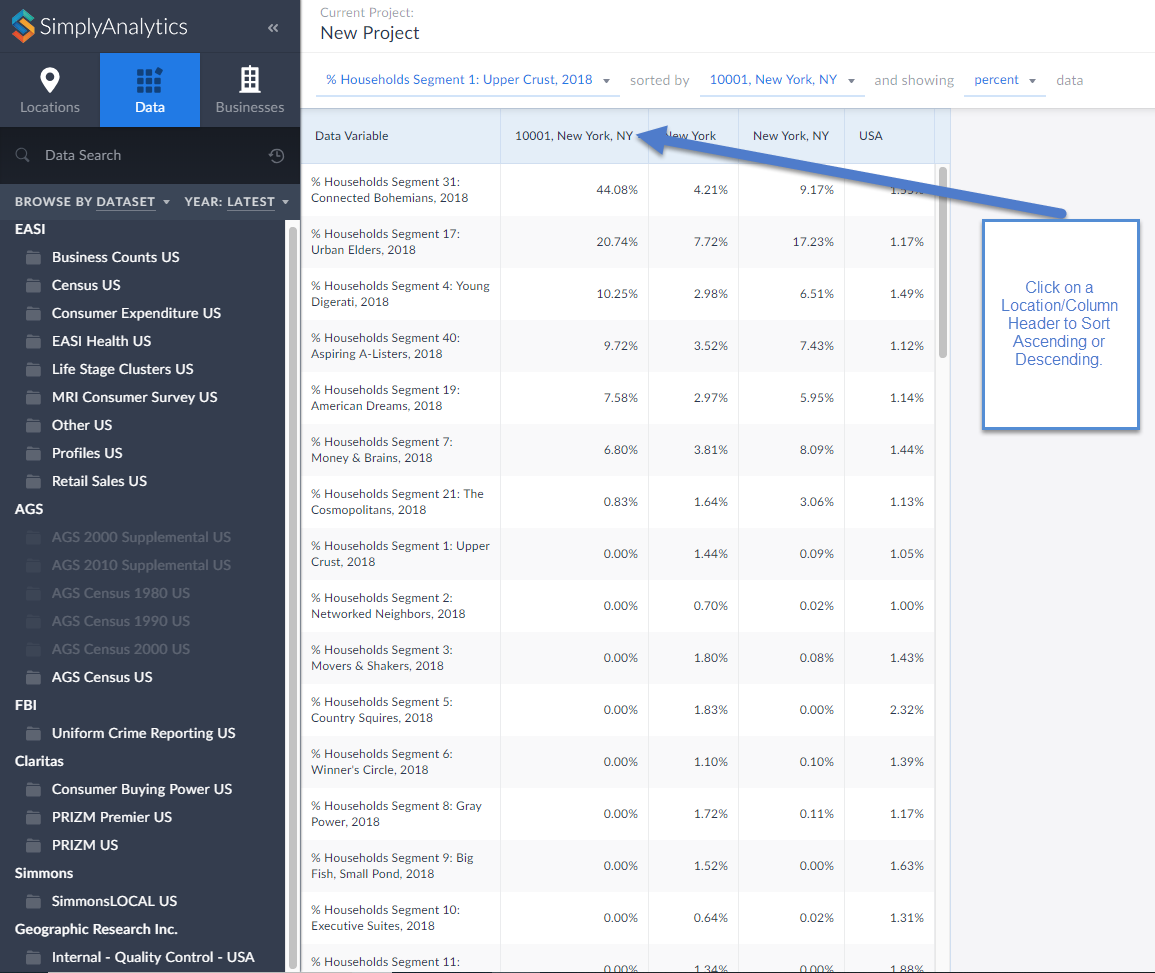
Click on the Location/column header to sort either Ascending or Descending. It looks like the ZIP Code 10001 in New York is largely classified as Connected Bohemians.
Click on the variable title to view the Metadata and learn more about this segment.
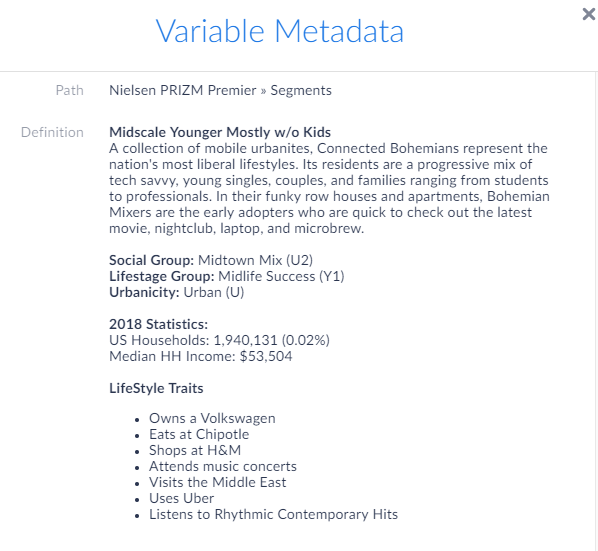
Interesting stuff! If your organization is interested in having a trial or webinar of the PRIZM dataset featured here, feel free to reach out to: support@simplyanalytics.com
More from SimplyAnalytics


Posted on Jun 09, 2021 by Admin
Hello (virtual) ALA attendees! Thank you for dropping by our booth to learn more about SimplyAnalytics. Please email us if you have any questions or would like a live demo or free 30 day ...
Posted on Feb 21, 2018 by Admin
We are looking forward to attending our first Electronic Resources & Libraries (ER&L) conference in Austin, TX! Visit us at Table #510 for a closer look at SimplyAnalytics – the b...
Posted on Feb 05, 2015 by Admin
Our Winter Sweepstakes has begun! Enter to win an iPad Mini 3 or Kindle Fire. How to Enter: Follow @SimplyMap on Twitter Like our SimplyMap Facebook Page for a 2nd Chance to Win If you ...
Posted on Feb 25, 2020 by Admin
SimplyAnalytics will be exhibiting at the PLA Conference, held this year at the Music City Center in Nashville, TN on February 26 - 28. Visit the team at Booth 1444 with your questions, f...
Posted on Aug 20, 2015 by Admin
Is there a specific age group and income bracket you are specifically interested in researching for a target location? Our Life Stages module has the information you need. Life Stages, by...
Posted on Jan 15, 2013 by Admin
The GRI team is looking forward to exhibiting at ACRL 2013 at the Indiana Convention Center in Indianapolis April 10 - 12, 2013. Every other year, ACRL offers its premier professional dev...
Posted on May 17, 2012 by Admin
We will be exhibiting at the American Library Association (ALA) Conference in Anaheim Friday June 22nd - Monday June 25th. Visit us at Booth 421 to learn more about SimplyMap and enter ou...
Posted on Nov 28, 2012 by Admin
Come visit the SimplyMap team at the ALA Midwinter Meeting, January 25 - 28, 2013 in Seattle, WA. We will be in Booth 1307, and as always we look forward to meeting with customers new and...
Posted on Nov 06, 2019 by Admin
Hello readers! We hope you’re having a wonderful week. Today we feature another entry from our From the Help Desk series. Let’s get started! Question: How do I analyze data for downtown? ...
Posted on Apr 10, 2015 by Admin
In this week’s SimplyMap report, we explore one of the newer datasets available: Retail Market Power®. What is it? In short, the Retail Market Power® dataset helps users identify opportun...