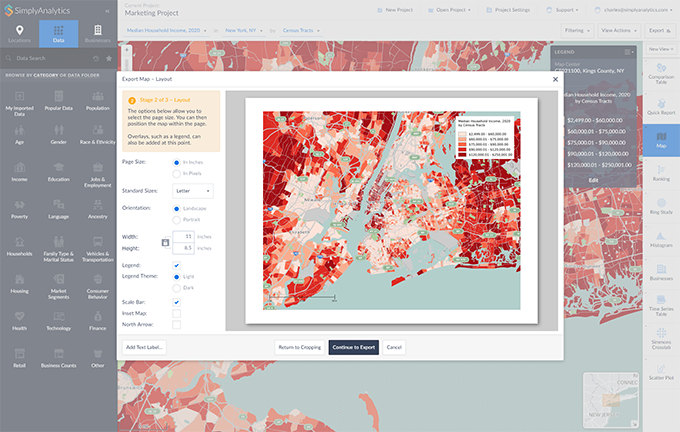
Interactive maps
Create professional interactive maps in seconds. Customize colors, data categories, boundaries, and more.
Check out what SimplyAnalytics has to offer and start building maps and reports in seconds.
Create professional interactive maps in seconds. Customize colors, data categories, boundaries, and more.

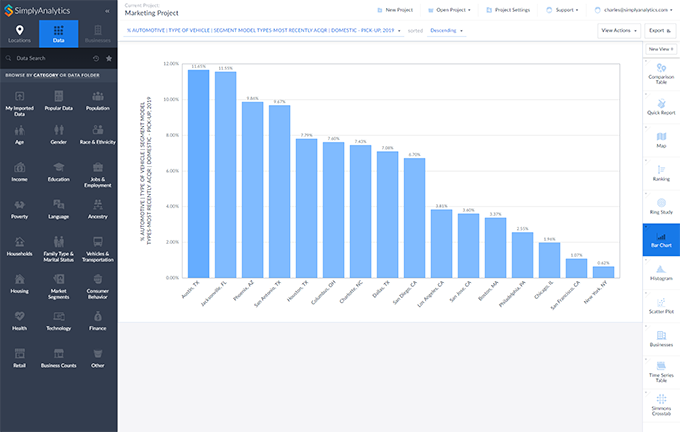
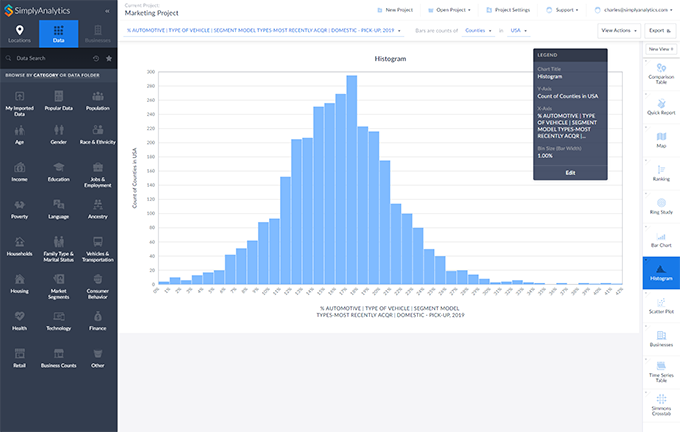
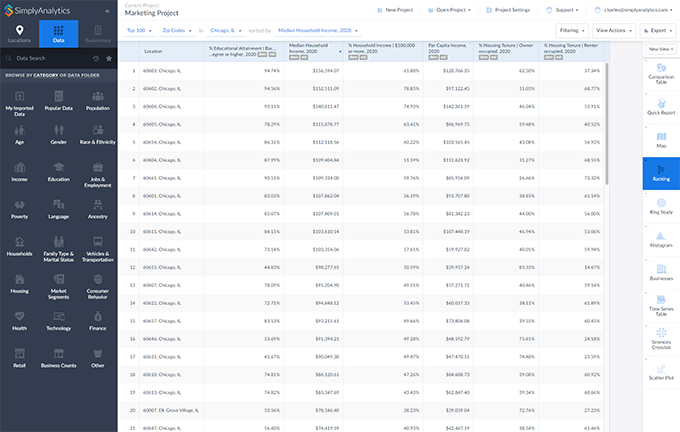
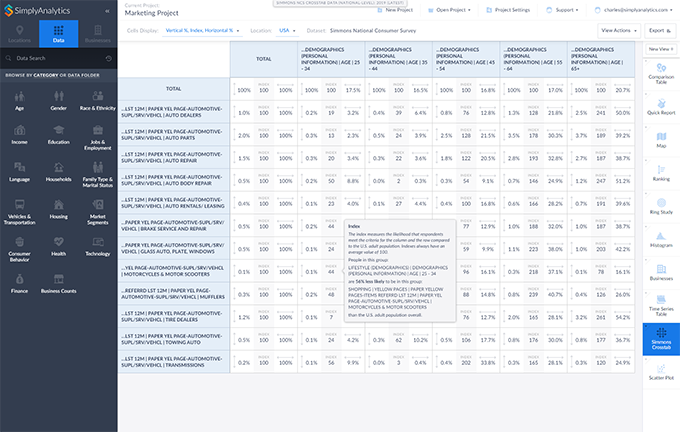
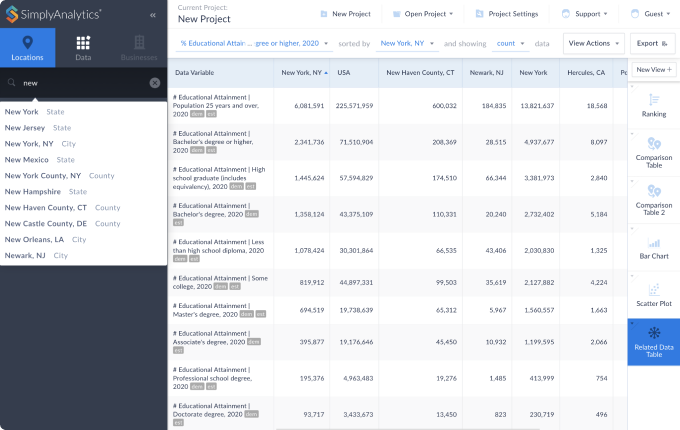
Generate detailed rankings, ring-study tables, comparison tables, and time-series tables. Or create a quick report displaying 150 data variables in seconds.
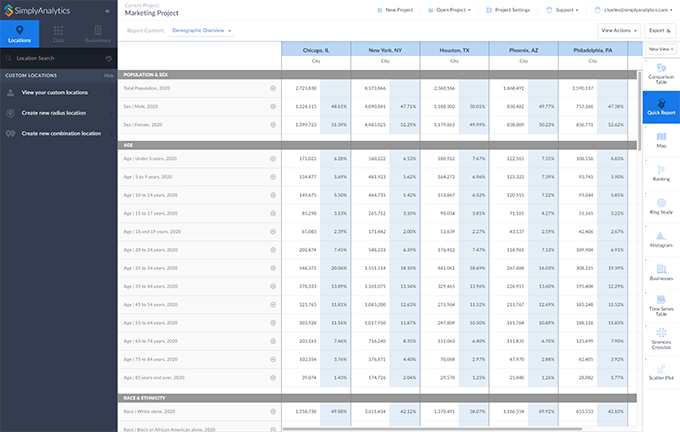
A quick and easy way to create a table with our most popular variables for multiple locations.
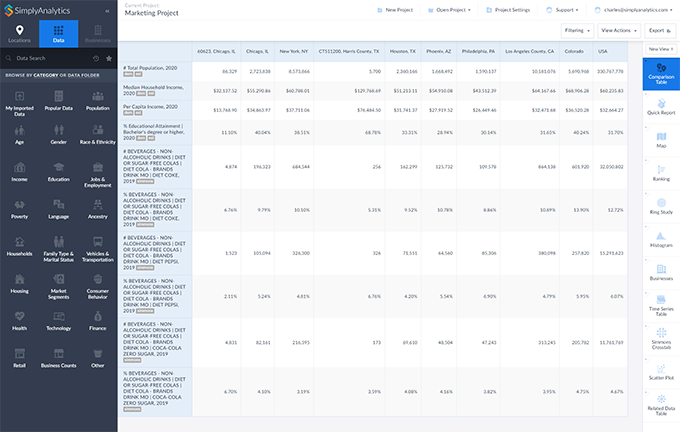
Add any types of locations (state, county, zip, tract, etc.) and any variables you choose.
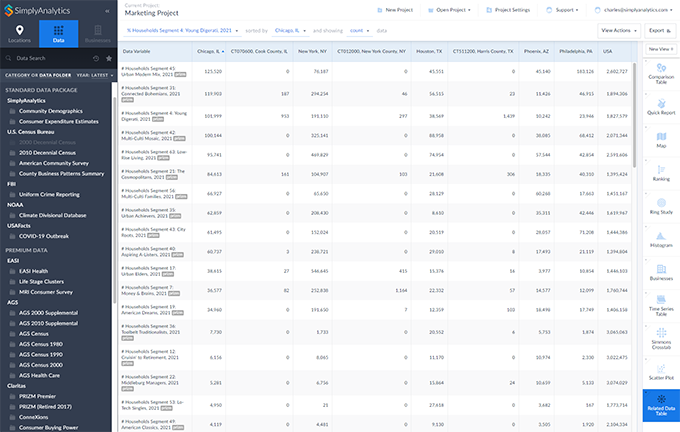
First select one "boundary" location, then select the geographic unit you are interested in, and then add data. For example, you can show data for all census tracts in Atlanta or counties in Texas.
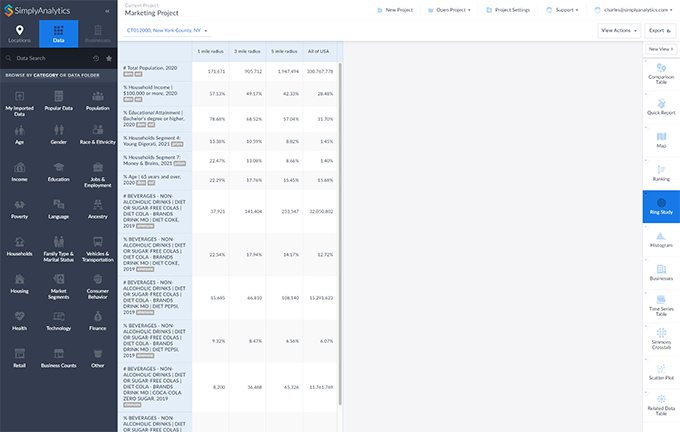
Select a central location and get a detailed table containing data for the 1mi, 3mi and 5mi rings around it.
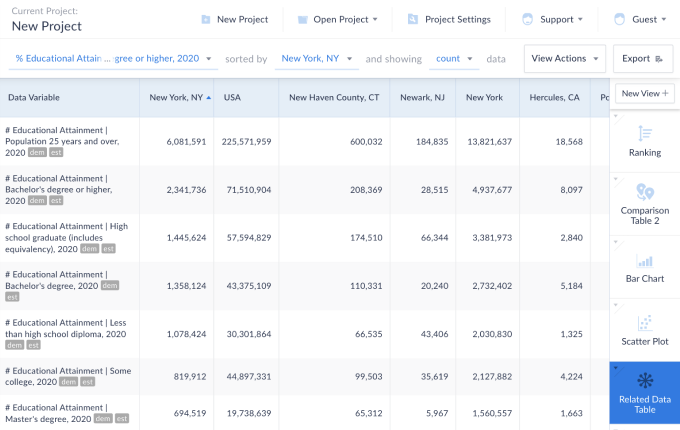
Add one data variable to this report and we will automatically add all of the related data for you. For example, if you add "% Households w/ Income $50,000 to $74,999" the report will also show all of the other income ranges as well.
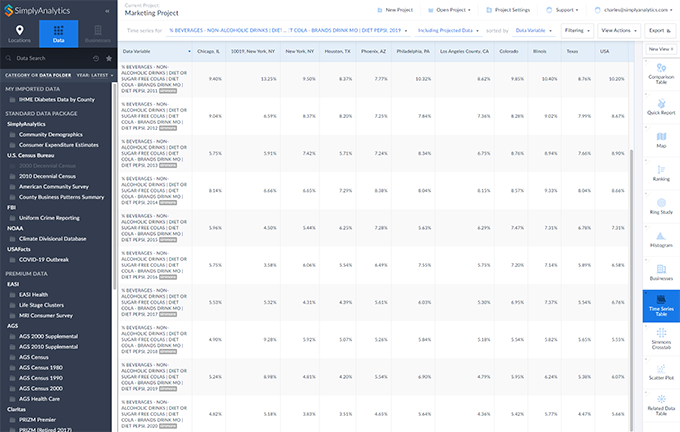
Add one data variable to this report and we will automatically add all years of data for that variable. For example, if you add "Median Household Income, 2017" the report will also show data for the years 2000, 2010, 2011, etc.
A quick and easy way to create a table with our most popular variables for multiple locations.
Add any types of locations (state, county, zip, tract, etc.) and any variables you choose.
First select one "boundary" location, then select the geographic unit you are interested in, and then add data. For example, you can show data for all census tracts in Atlanta or counties in Texas.
Select a central location and get a detailed table containing data for the 1mi, 3mi and 5mi rings around it.
Add one data variable to this report and we will automatically add all of the related data for you. For example, if you add "% Households w/ Income $50,000 to $74,999" the report will also show all of the other income ranges as well.
Add one data variable to this report and we will automatically add all years of data for that variable. For example, if you add "Median Household Income, 2017" the report will also show data for the years 2000, 2010, 2011, etc.

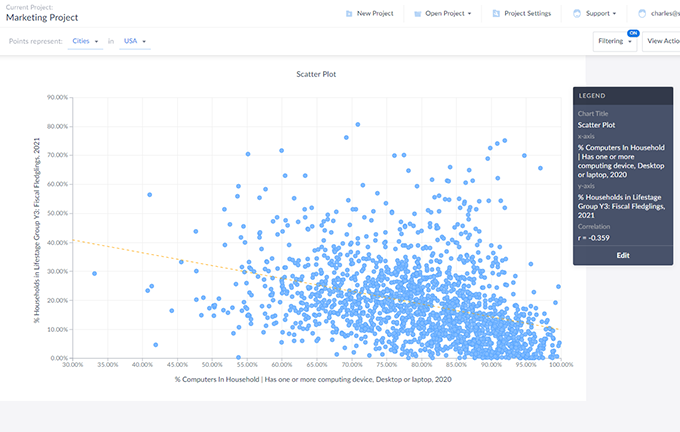
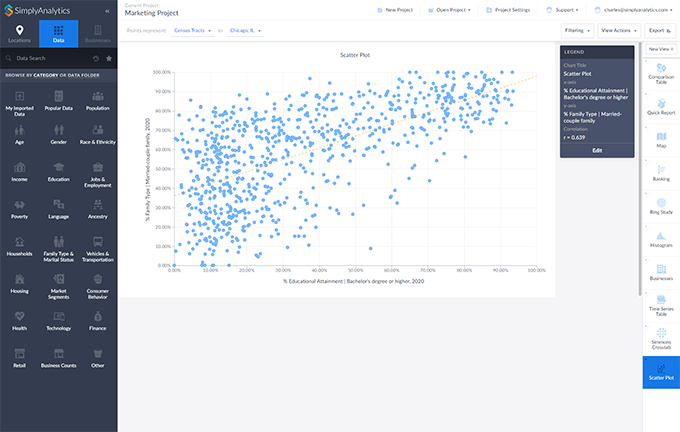
Analyze the relationship between two variables, such as demographic characteristics and consumer purchases.

Quickly identify target areas in maps and reports using custom data filters.
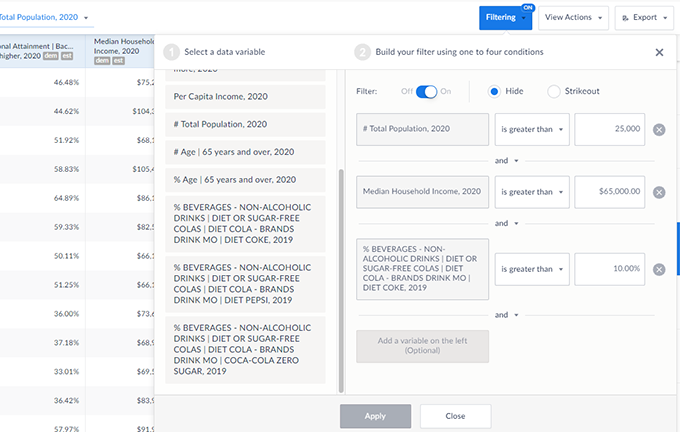
Quickly identify target areas in maps and reports using custom data filters.

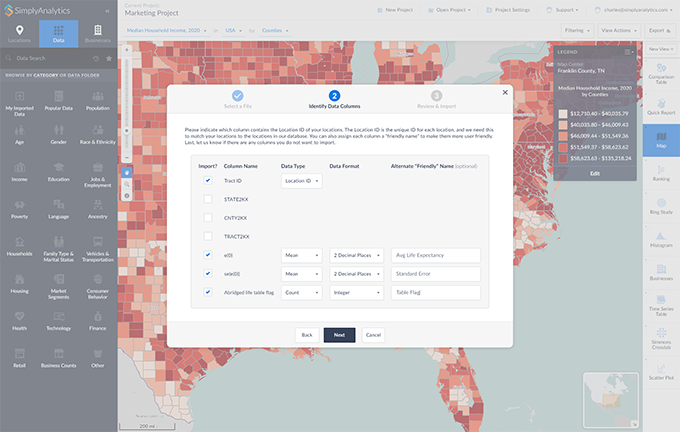
Bring your data into SimplyAnalytics and combine it with our 200,000+ data variables to create detailed analyses.

Everything you create in SimplyAnalytics can be exported for use in presentations, reports, and spreadsheets.
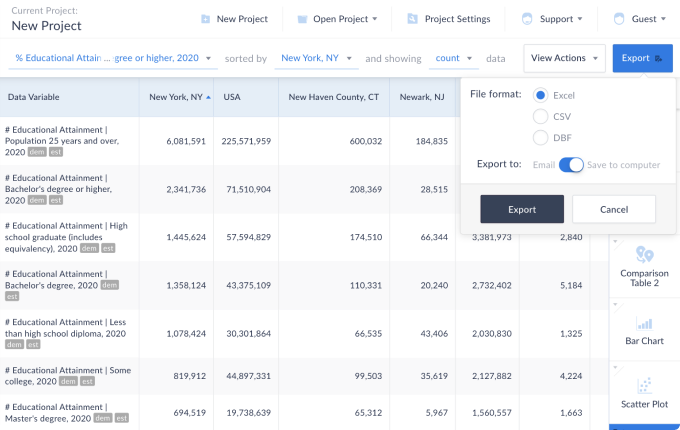
Everything you create in SimplyAnalytics can be exported for use in presentations, reports, and spreadsheets.

After years of research and feedback we’ve created an incredible user experience that makes it quick and easy to answer complex questions.

Our concise tutorials, live chat, and industry-leading customer support will delight you.
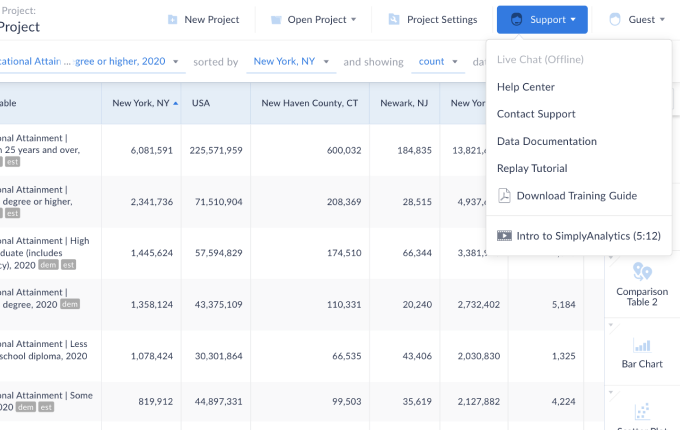
Our concise tutorials, live chat, and industry-leading customer support will delight you.